Dashboard
This is the homepage for your deployment, and by default you will be taken to this page when you login.
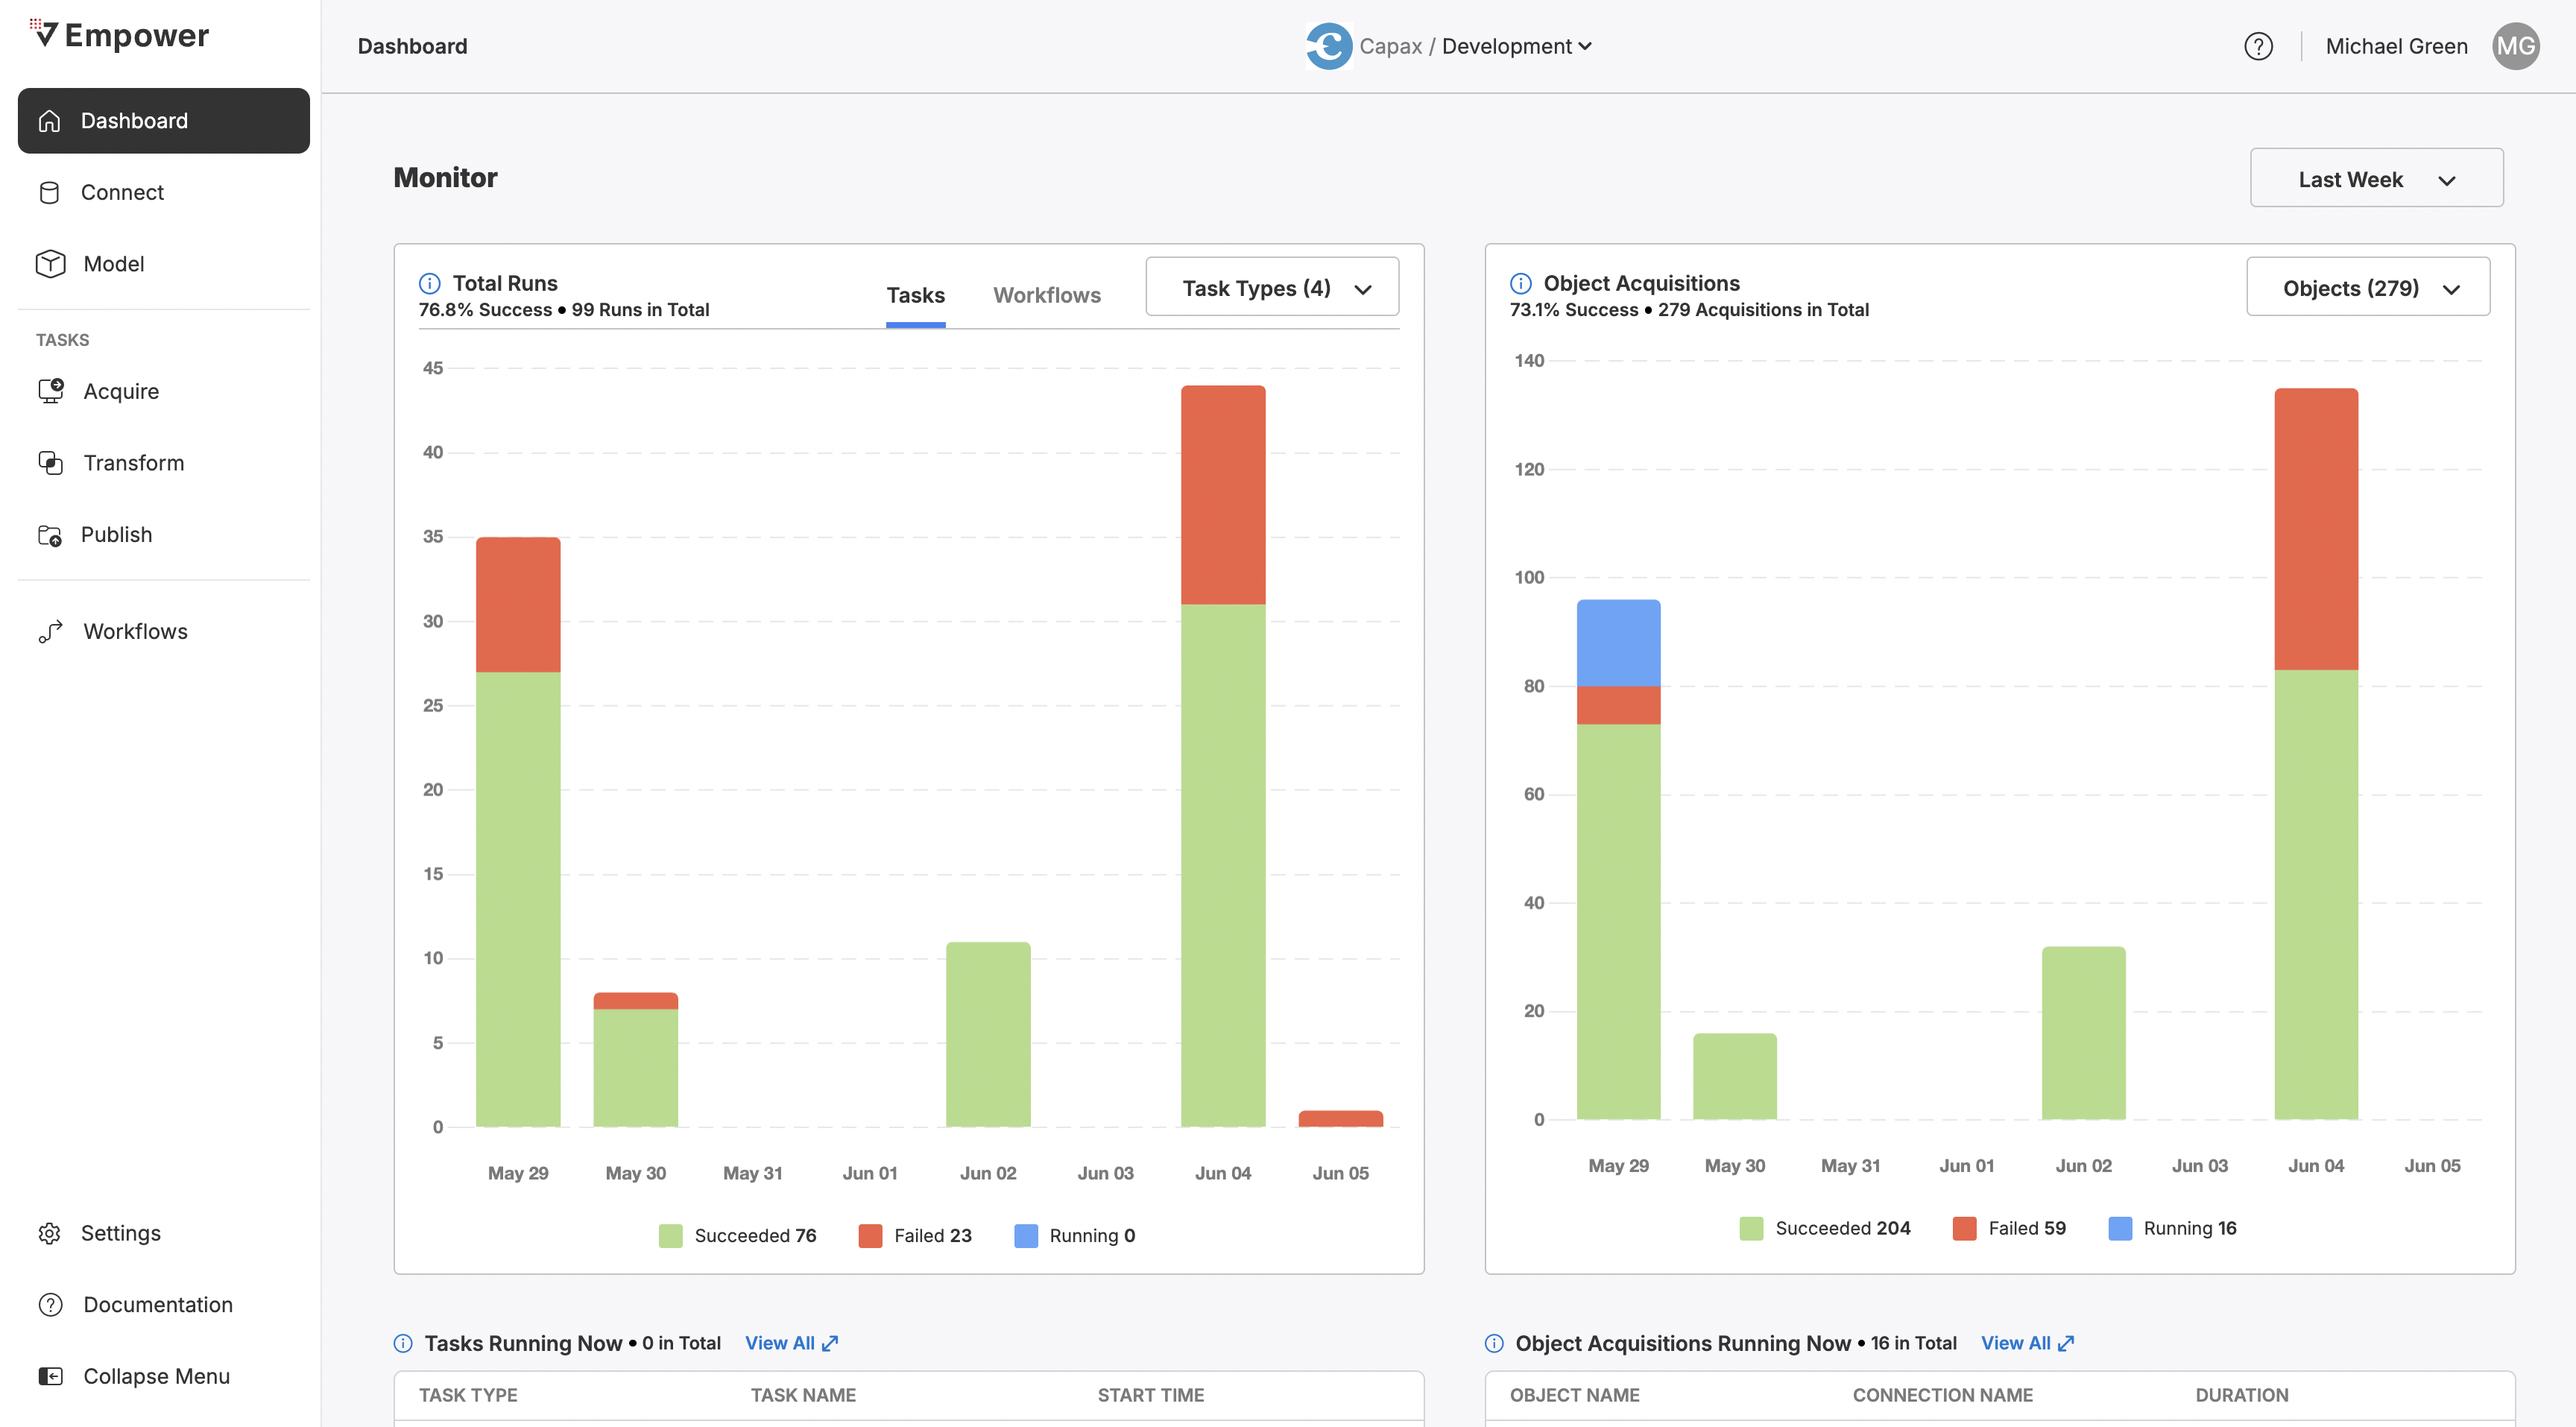
The dashboard module.
The dashboard provides a centralized view of your data pipeline operations. It’s the first place you go to understand the current state of your environment—what’s running, what’s failed, and what needs attention.
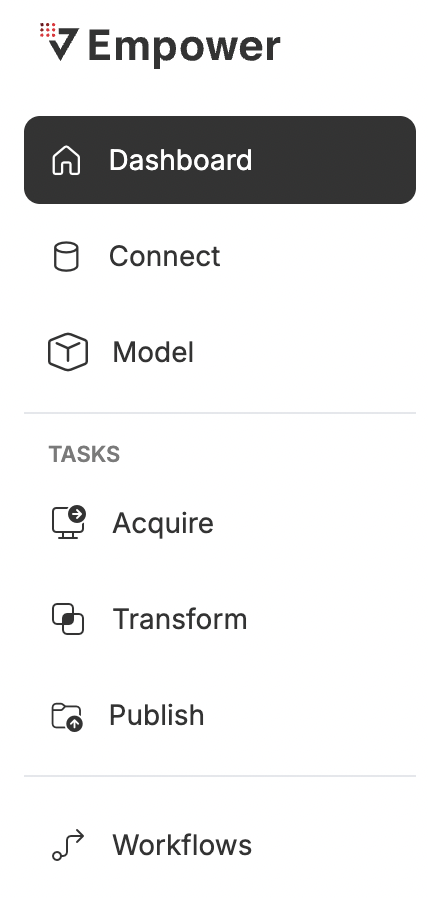
To visit the Dashboard module, click Dashboard on the nav menu.
Use the dashboard to:
- Monitor pipeline health at a glance.
- Track recent activity and system alerts.
- Review key metrics such as run time and success/failure rates.
- Quickly navigate to specific tasks, logs, or pipelines needing review.
Whether you're a data engineer troubleshooting an issue or a platform owner tracking usage trends, the dashboard gives you the operational heartbeat of your data environment.
Filtering by Time
You may filter this entire page to view a specific period of time using the timeframe dropdown in the top right corner of the screen.
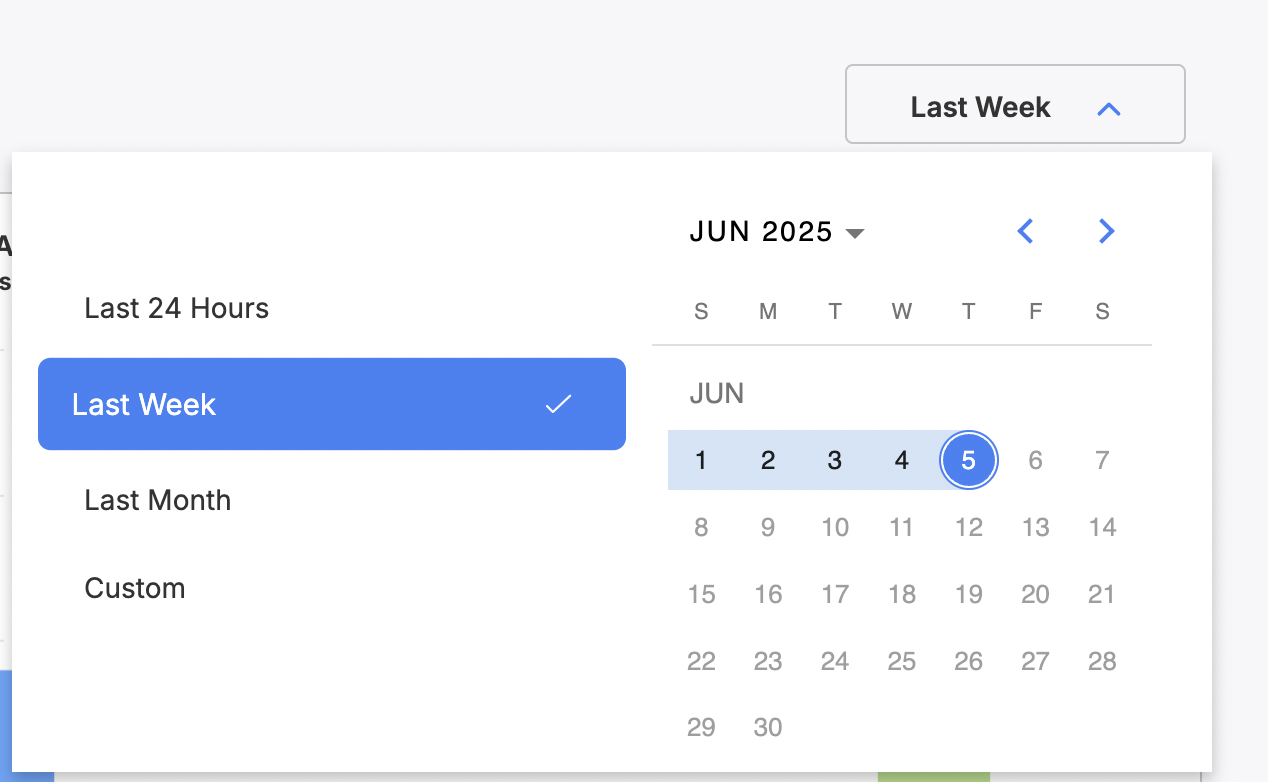
Use the timeframe dropdown to filter to the last 24 hours, the last week, month, or a custom set time period.
Task/Workflow Monitoring
On the right side of the dashboard, you can observe both task and workflow runs within the environment you are operating within.
Task/Workflow Runs Graph
This graph will show you task and workflows that have either succeeded, failed, or are currently running. It will not show those that are queued or scheduled to run. To switch between Task and Workflow observation, use the tabs at the top-center of the graph.
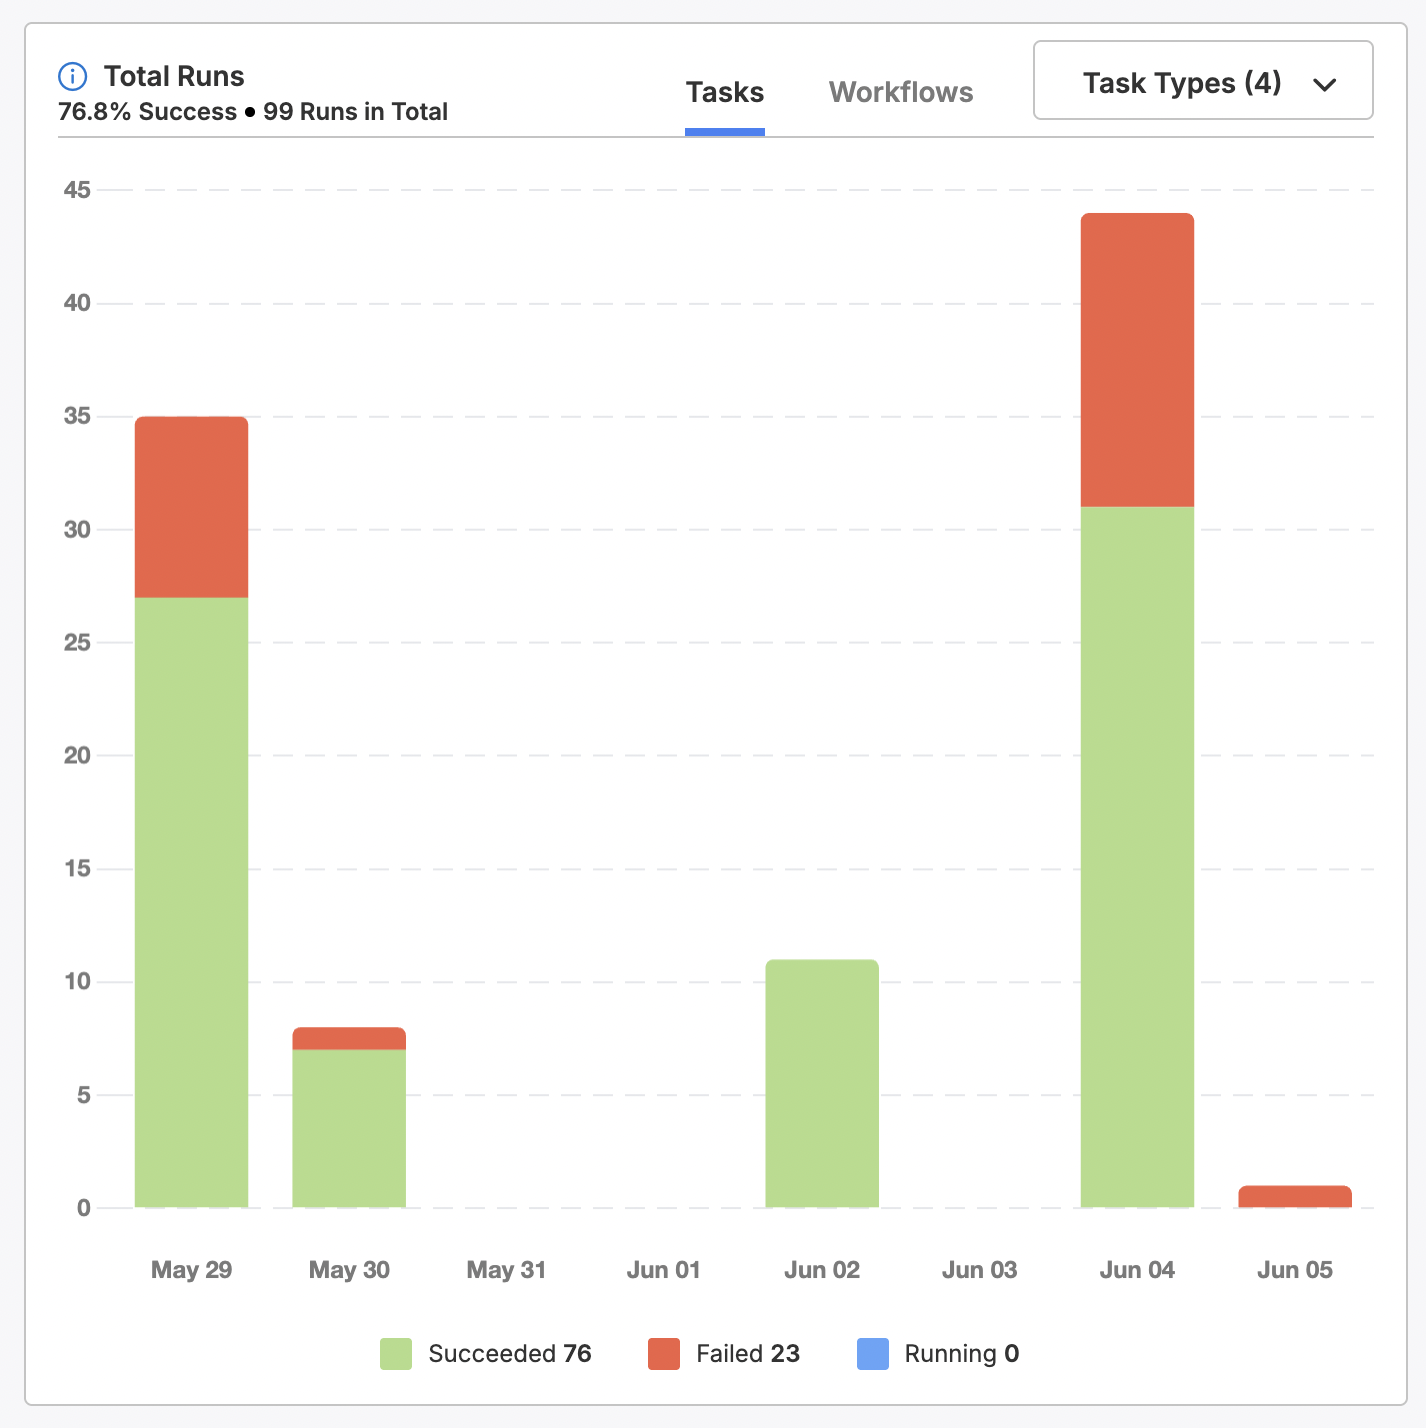
Observe run information for either Tasks or Workflows at a high-level view.
You may opt to filter to specific Task types when viewing Task runs. To do so, click the dropdown (Task Types) and filter to the types you wish to view.
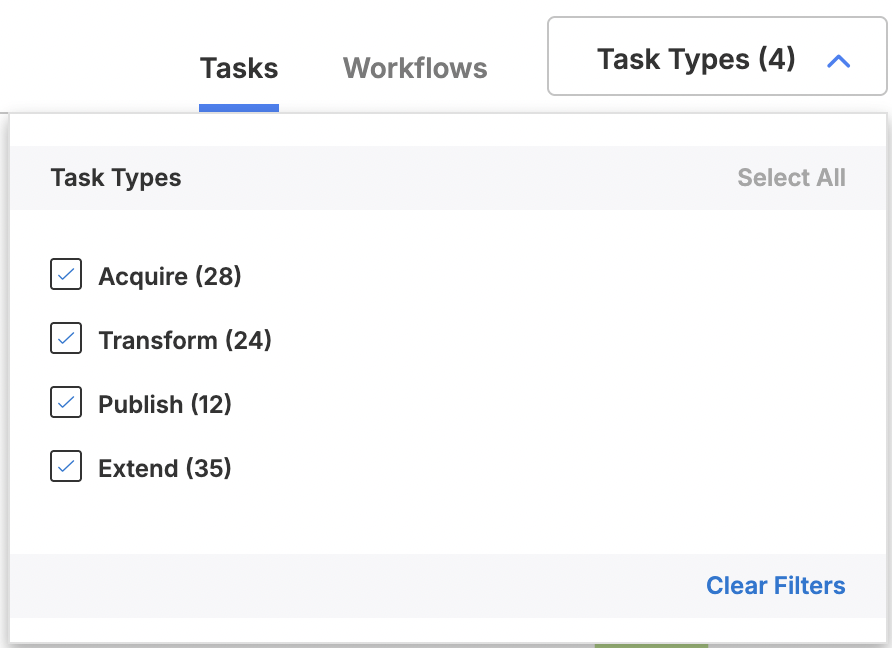
Filter task runs by task type using the dropdown.
Tasks Running Now
Scroll further below the chart to see a table of all Tasks running now. For each task, you can view the type of task, the name, and when the task began running.
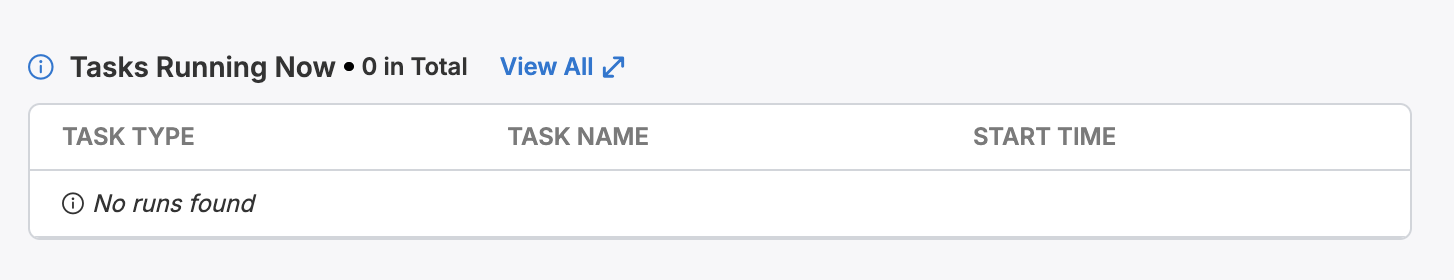
Click View All to see this table in greater detail, including Run ID information and Duration.
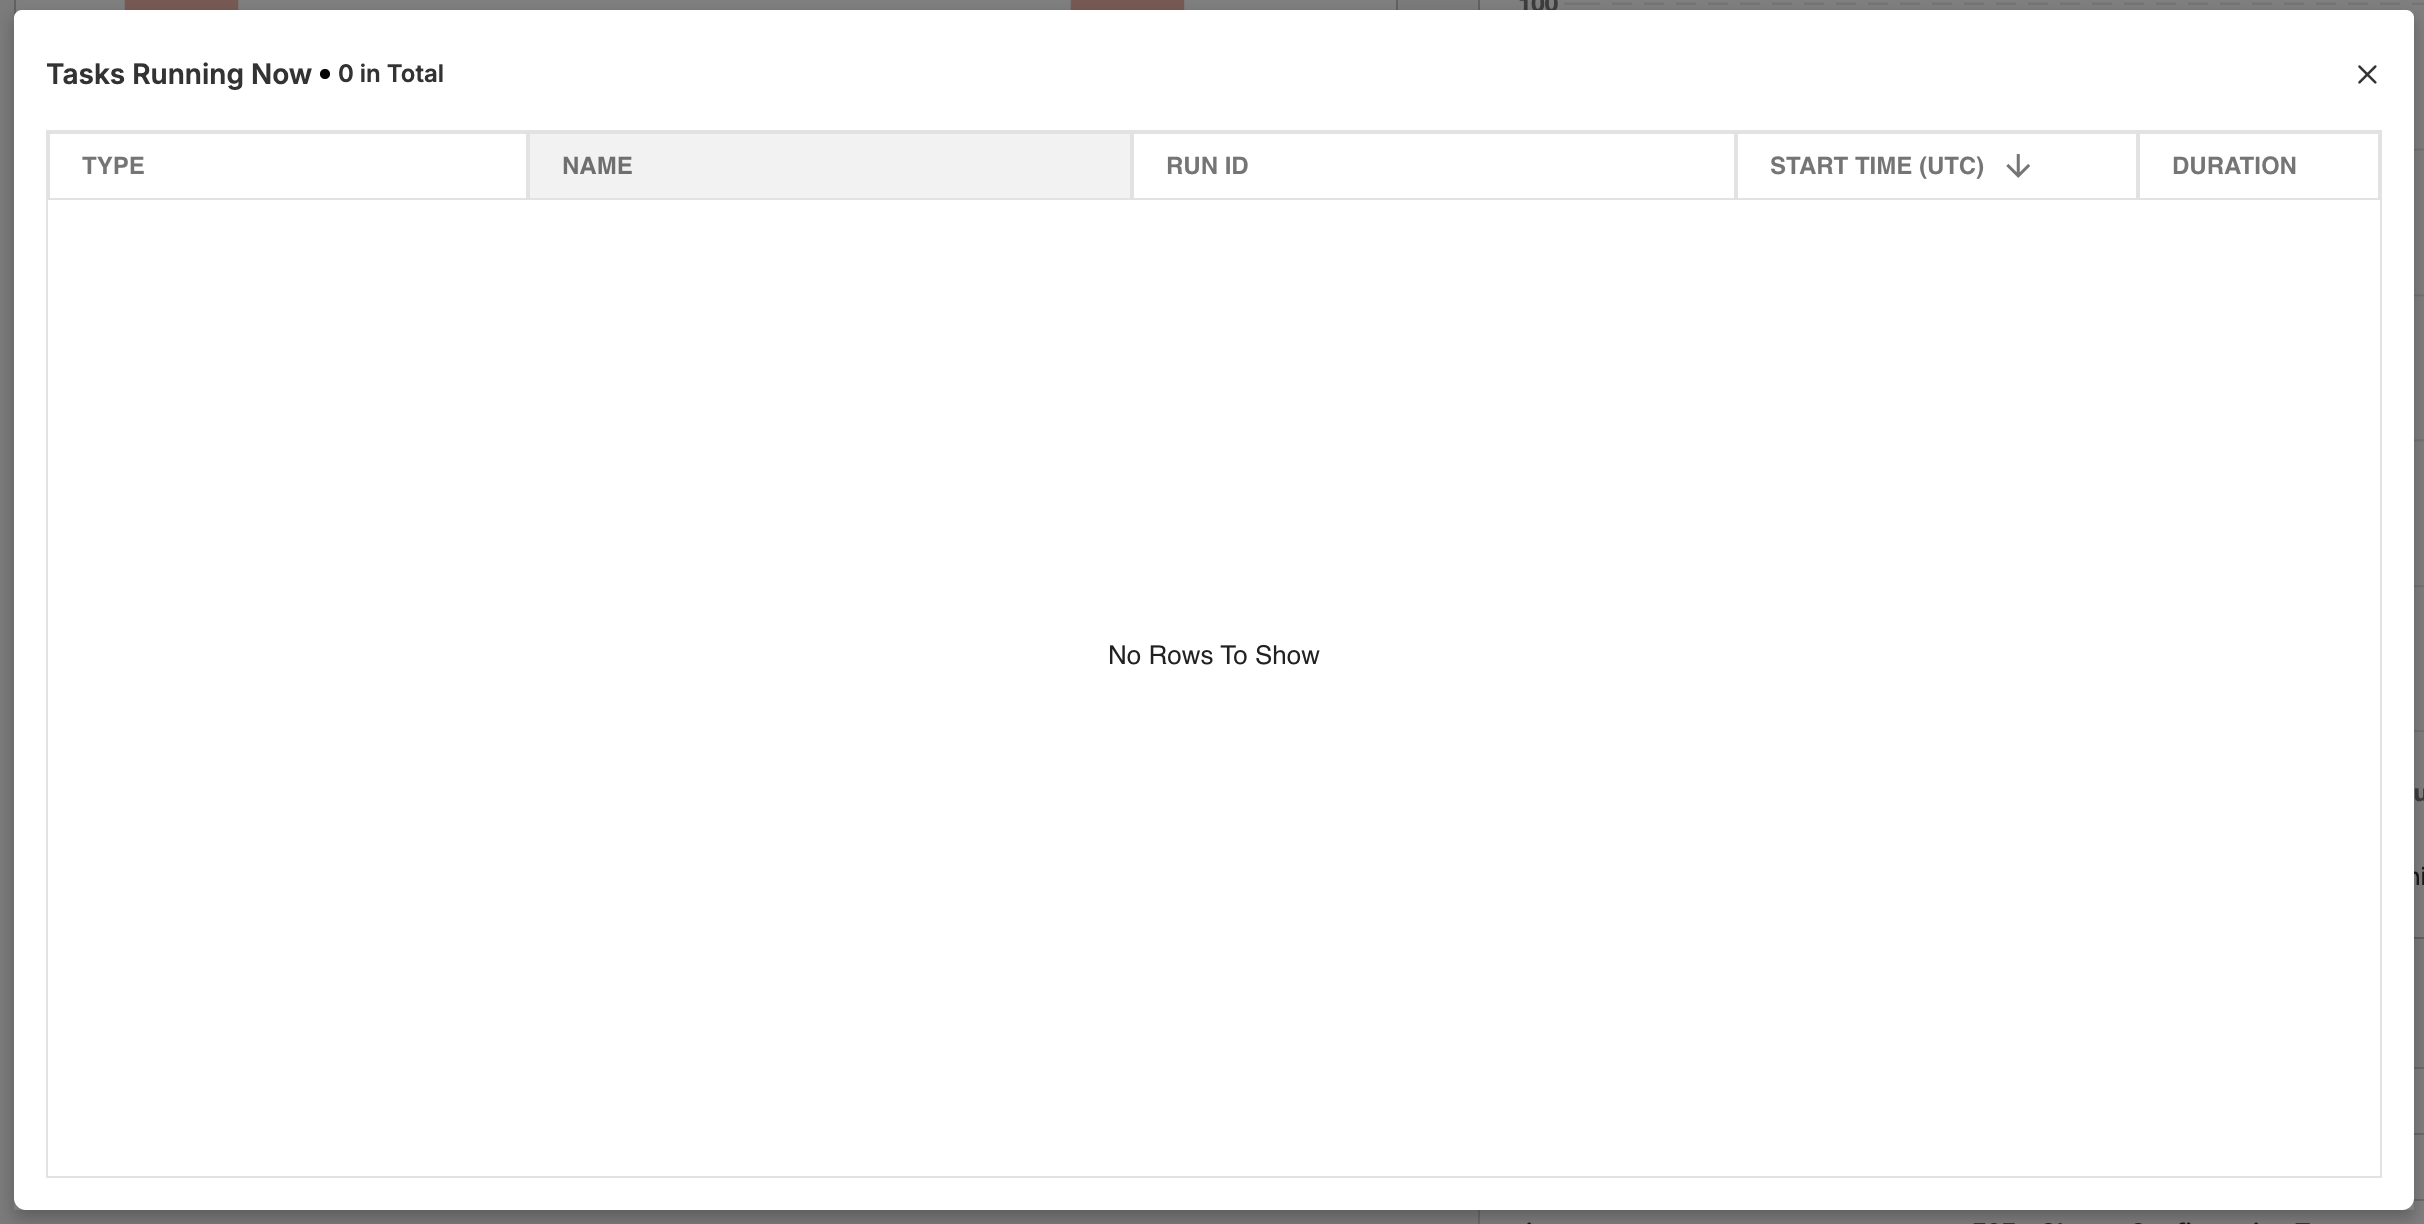
View additional information about currently running tasks when you click View All.
Objects
On the right side of the dashboard, you can observe all objects being ingested with Acquire Tasks into your Lakehouse. This graph will show you all successfully required object acquisition instances, failures, and objects currently being synced. It will not show you objects that are scheduled or queued to be synced.
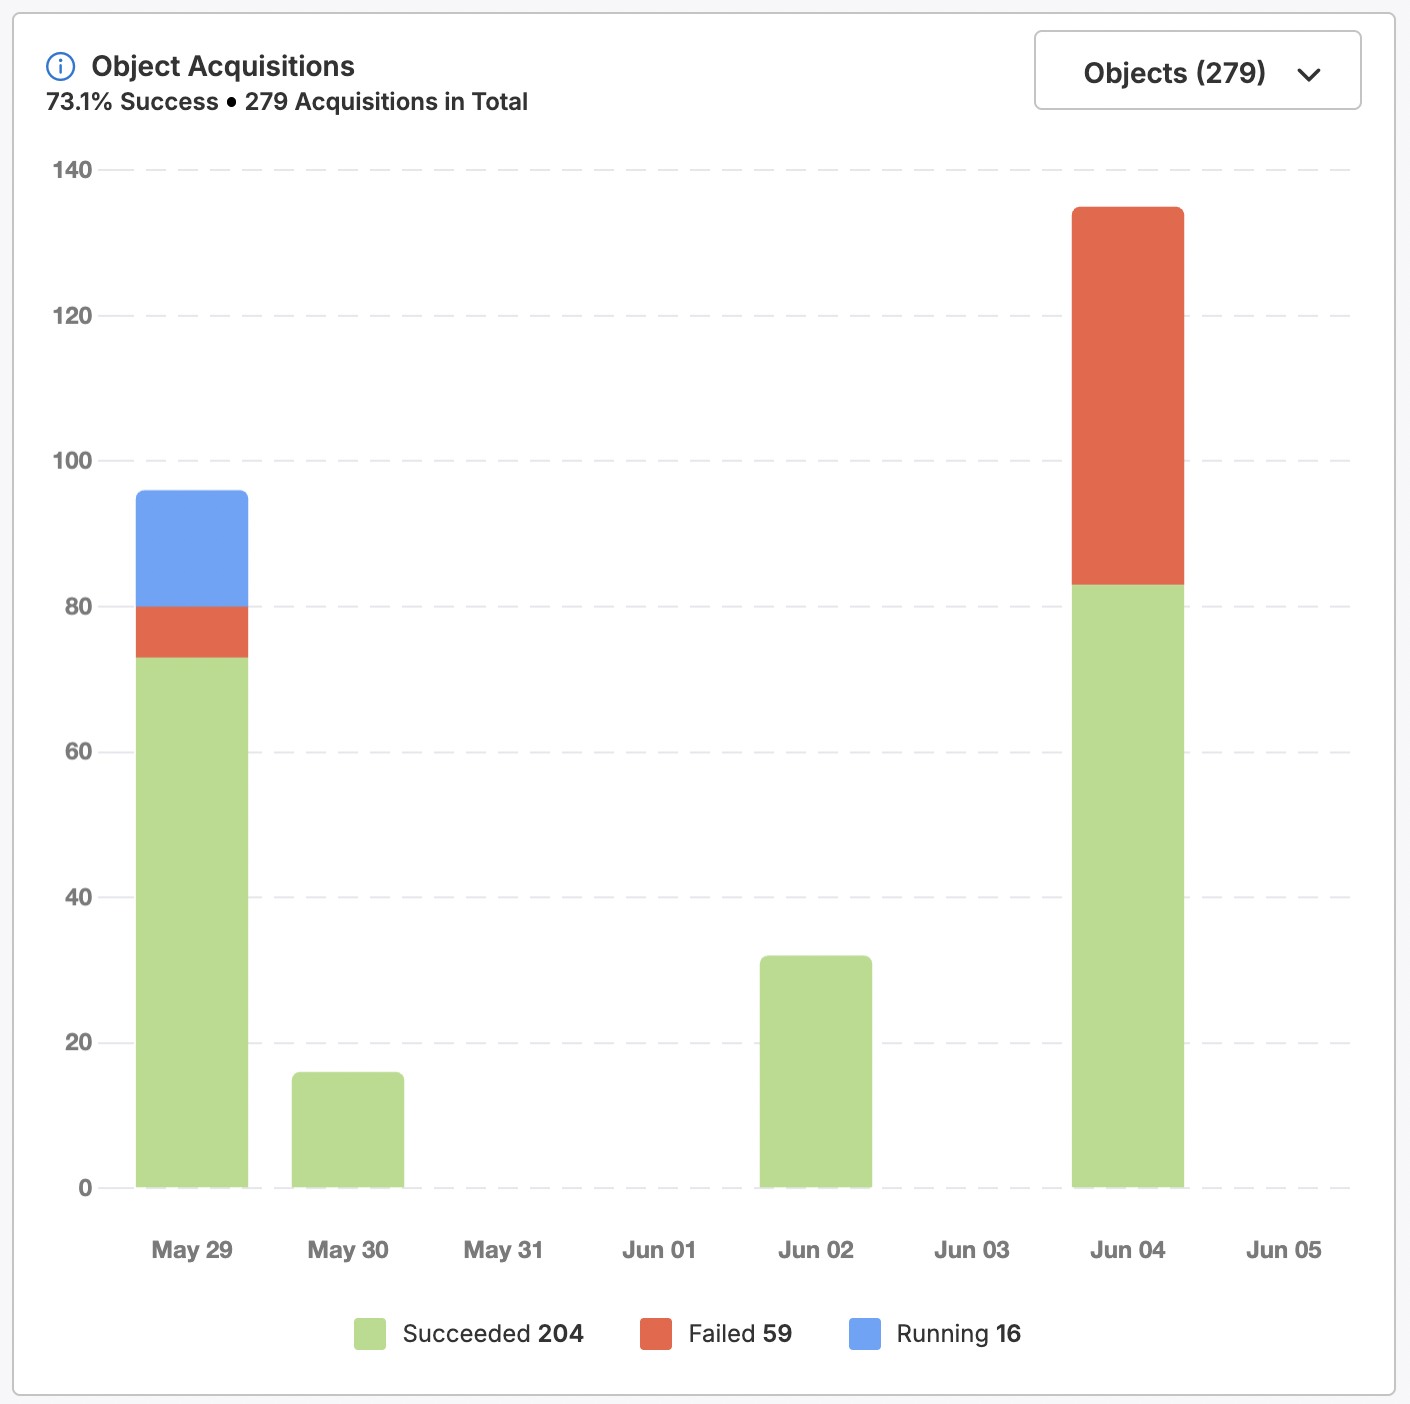
Observe run information for all acquired objects in your Lakehouse.
You may elect to filter this graph to specific subsets of objects, rather than all of them. Use the Objects dropdown to do so and select which objects you wish to view or hide.
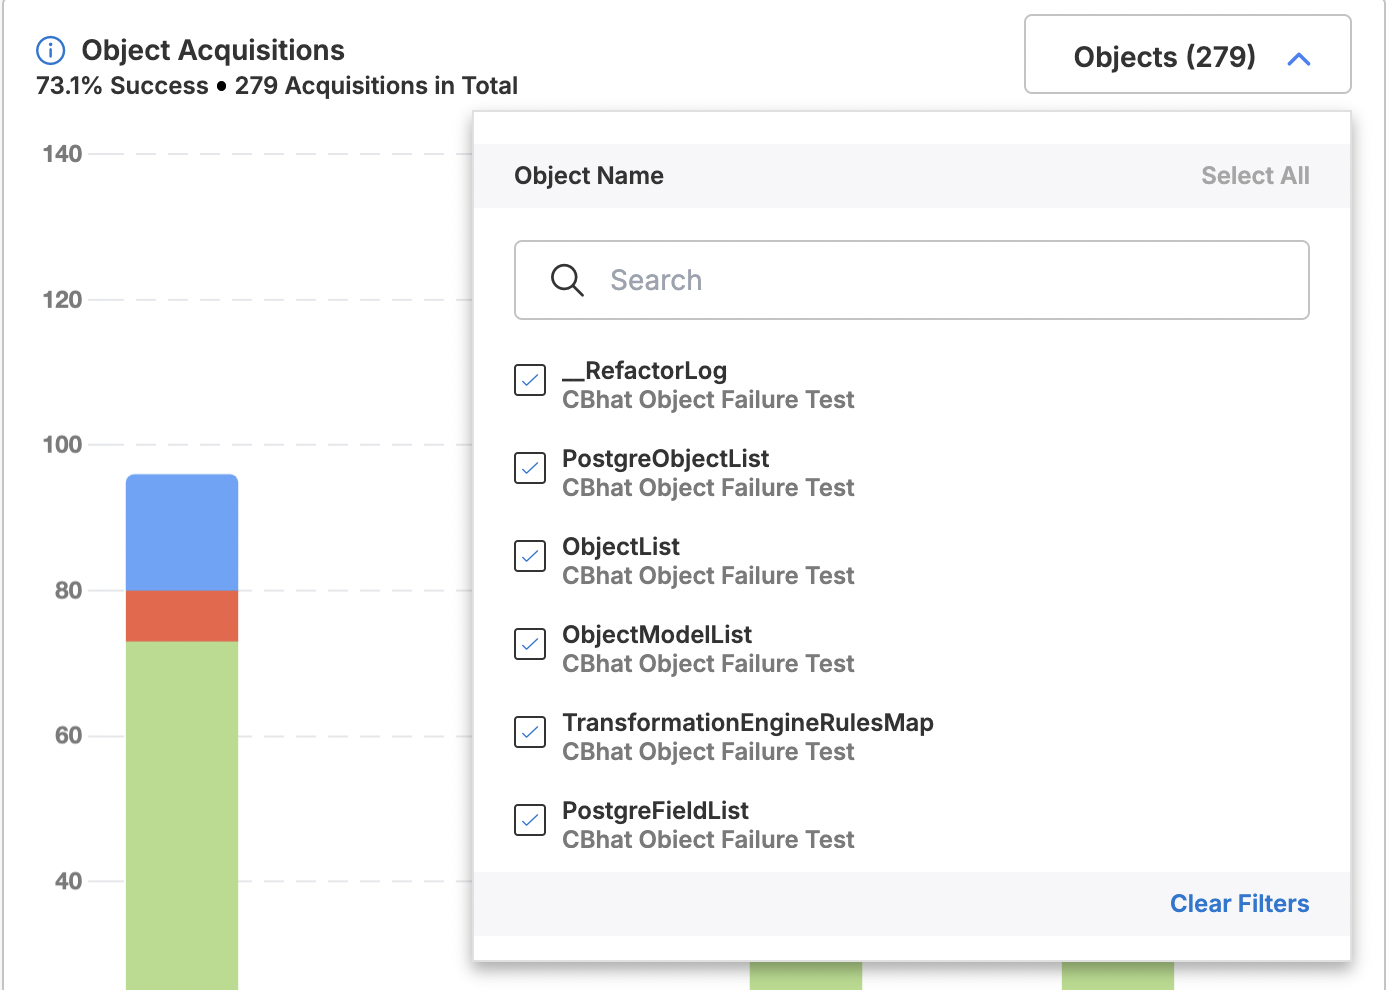
Use the Objects dropdown to filter this graph to specific objects.
Objects Acquiring Now
Scroll further down under the graph to see a table displaying objects being acquired into your Lakehouse right now. For each object, view its name, the name of the connection it belongs to, and how long it has been running.
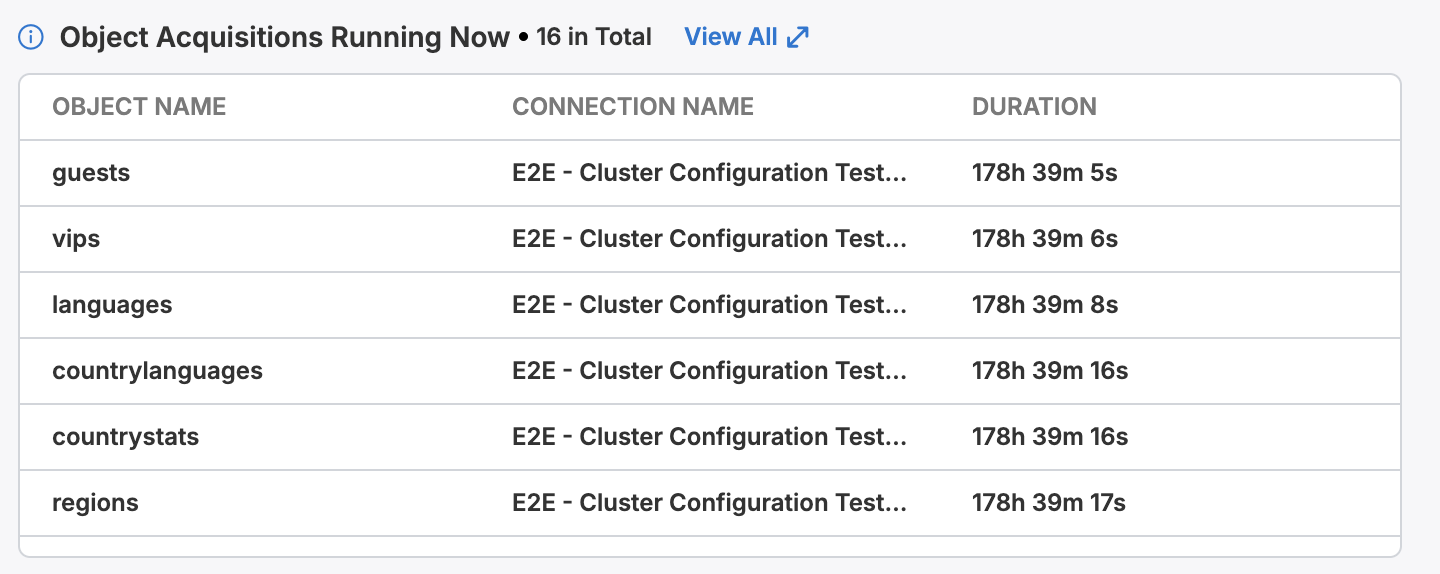
Click View All to see this table in greater detail, including Connection Type, the name of the task aquiring this data, and when this task began.
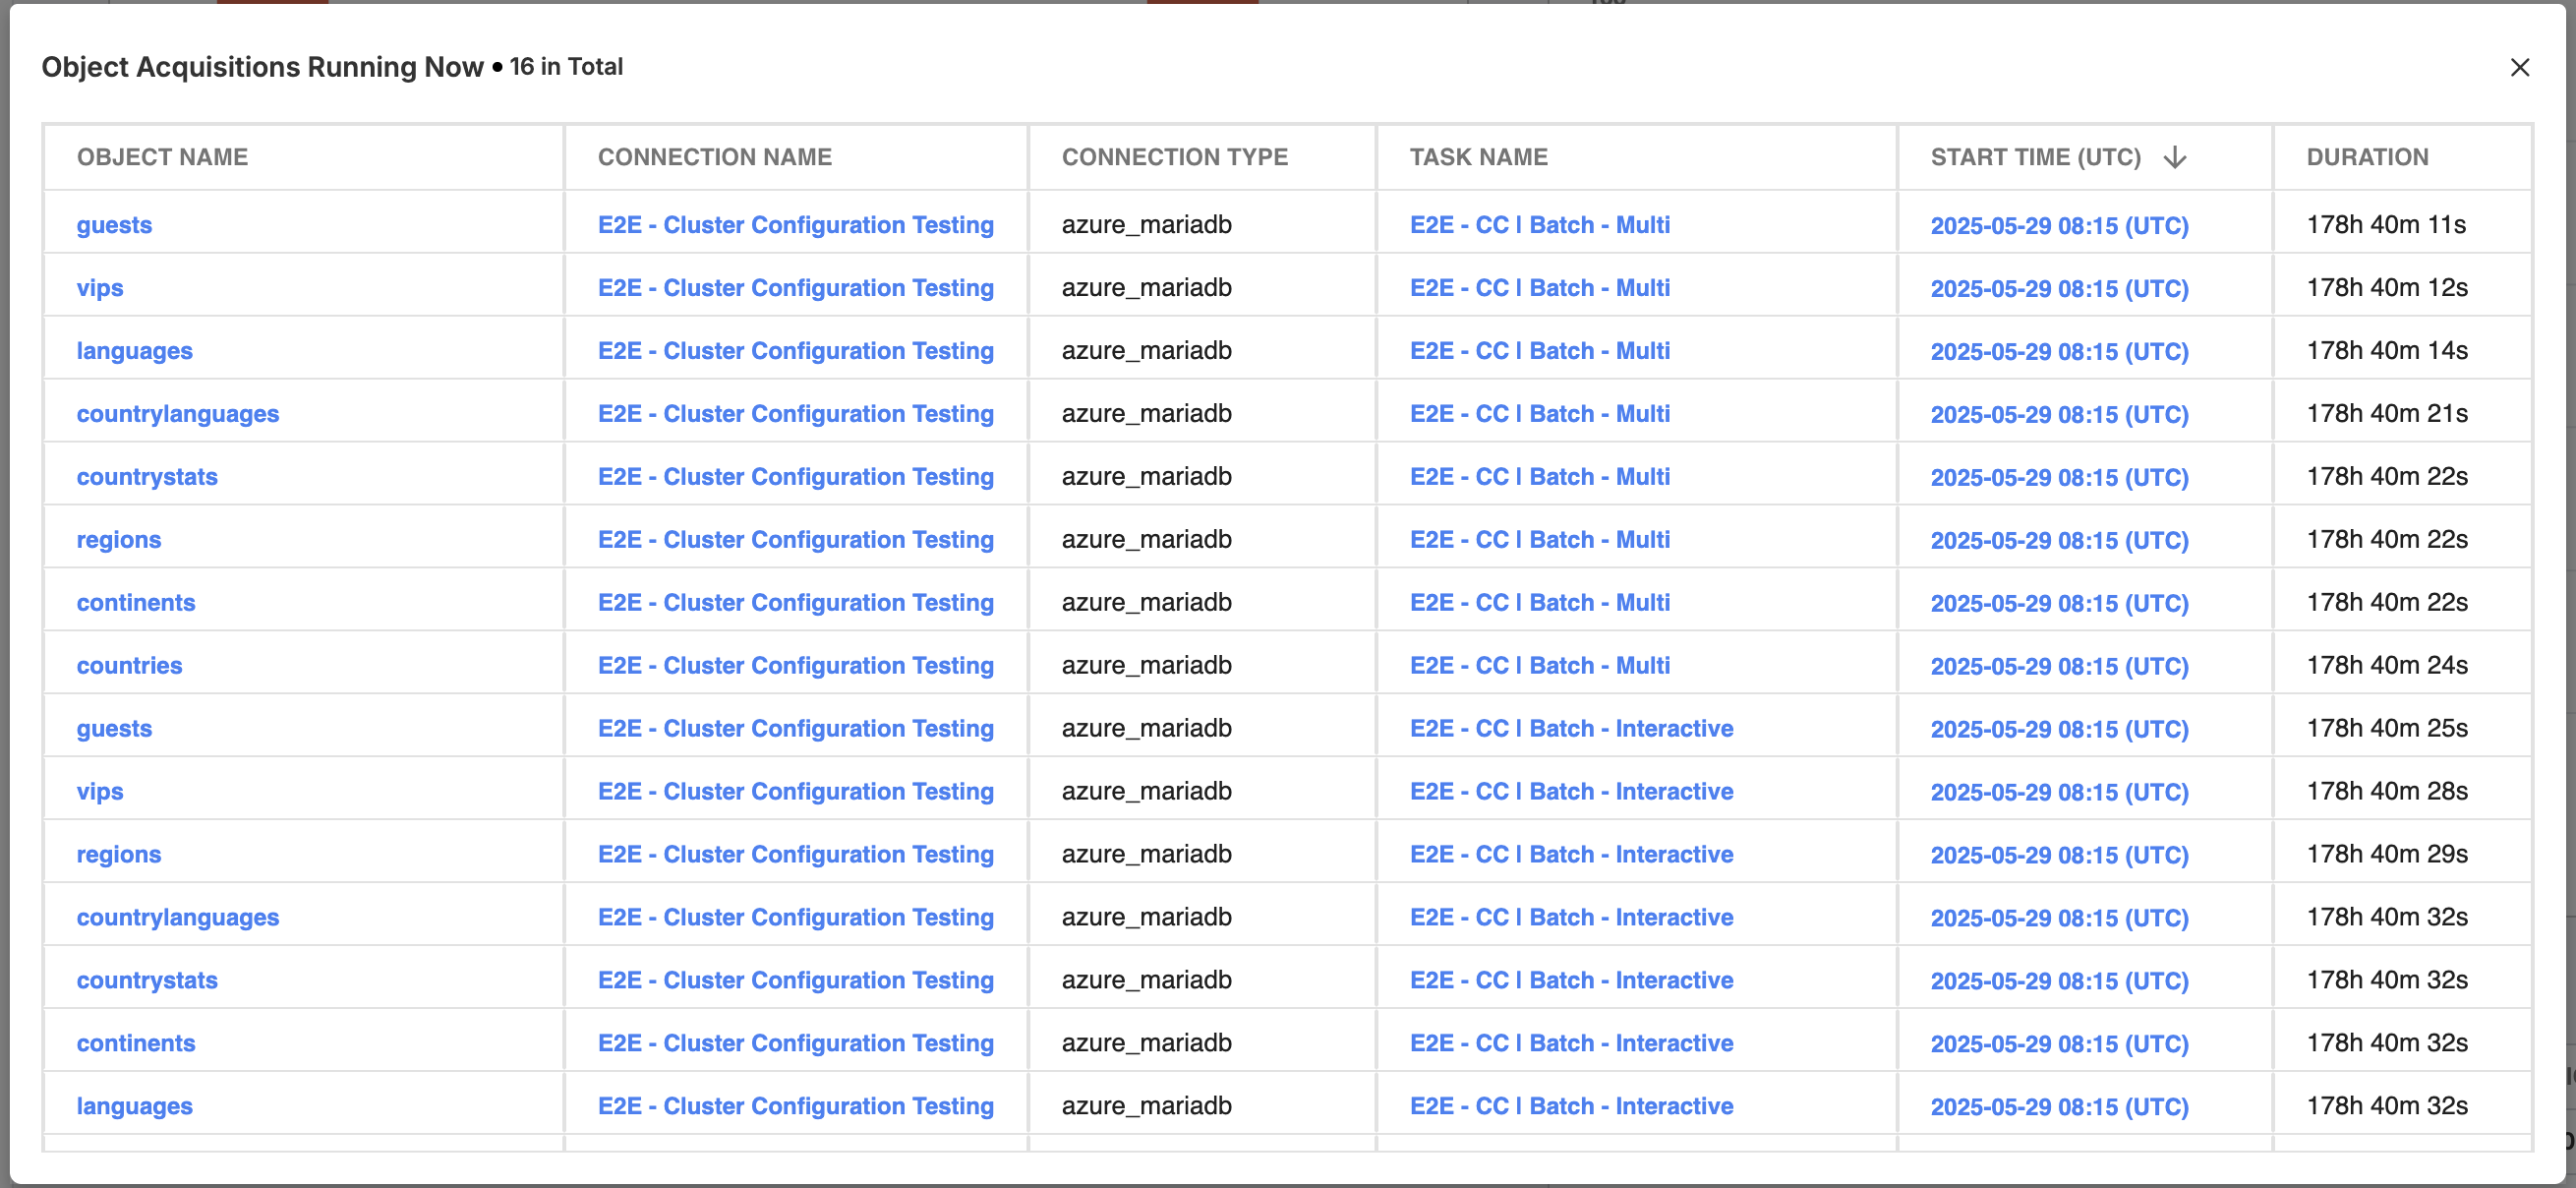
Click View All to see more information about currently acquiring objects.
Updated 9 months ago